AUD/JPY H4 Chart Analysis (Primary Trend)
Trend and Phase Identification
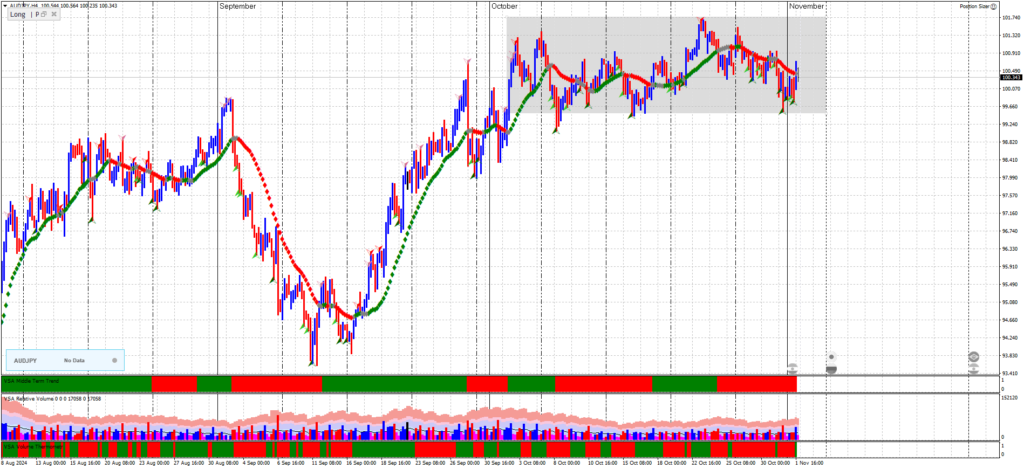
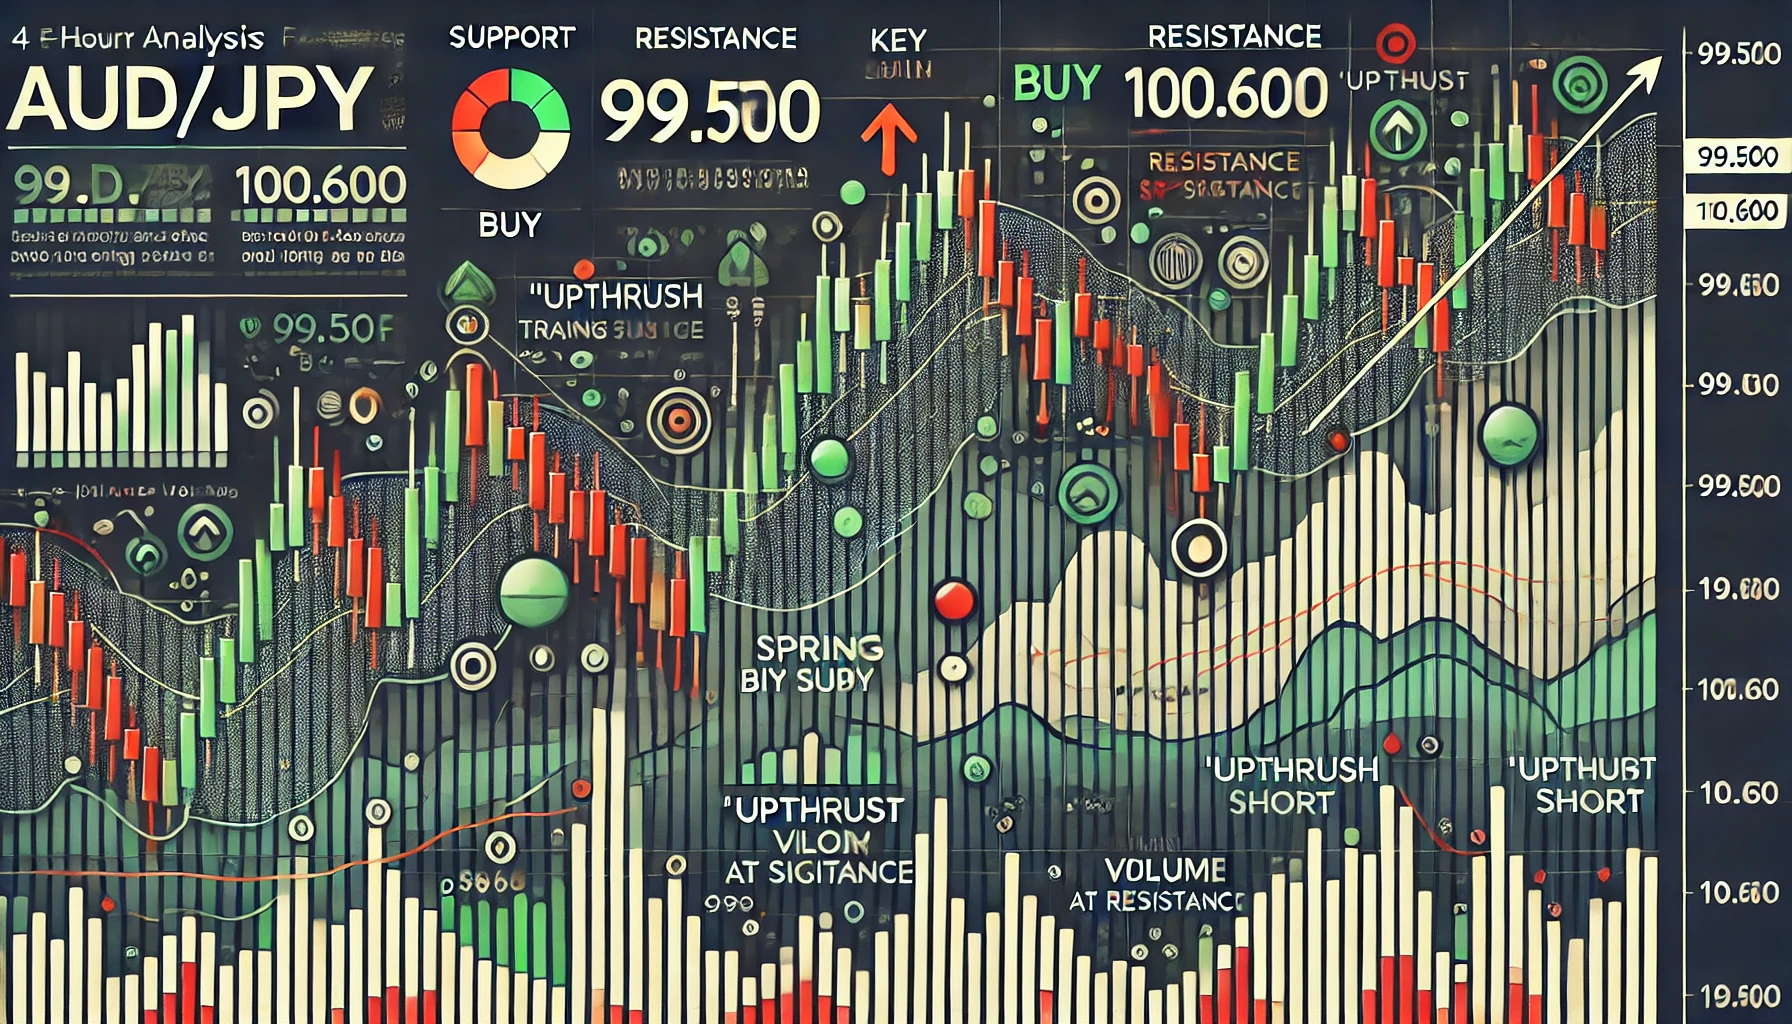
- The H4 chart for AUD/JPY shows a generally sideways movement within a range, suggesting a distribution or re-accumulation phase. The price oscillates between approximately 100.600 (resistance) and 99.500 (support).
- This range-bound movement aligns with a potential re-accumulation phase if the broader trend is upward. Alternatively, if the broader trend is down, this range could be a distribution phase, setting up for a markdown.
Wyckoff Events
- Preliminary Support and Resistance: There are multiple touches of the support near 99.500, with volume spikes suggesting that buyers are absorbing selling pressure.
- Potential Upthrusts and Springs: In the upper part of the range (around 100.600), the price has repeatedly tested resistance with no strong breakout, suggesting selling pressure at the top. Springs could appear near the 99.500 level, where buyers step in after brief dips below support.
- Signs of Weakness/Strength: The lack of a strong breakout past 100.600 indicates that sellers might be defending this area, though a breakout could shift this bias to the upside.
Volume Analysis
- Volume Spikes at Support: Volume spikes around 99.500 indicate that buyers are stepping in when prices dip to support, potentially signalling absorption.
- Diminished Volume Near Resistance: When prices approach 100.600, the volume does not significantly increase, suggesting a lack of aggressive buying pressure at the upper boundary, which could indicate distribution if volume doesn’t pick up on a breakout attempt.
Trading Implications on H4
- Buy Opportunities: Look for buy entries on spring events near 99.500 with strong volume to confirm support.
- Sell Opportunities: If the price approaches 100.600 and forms an upthrust (a brief breakout with quick reversal), this could present a shorting opportunity if volume supports a rejection.

AUD/JPY H1 Chart Analysis (Mid-Level Trend Analysis)
Trend and Phase Identification
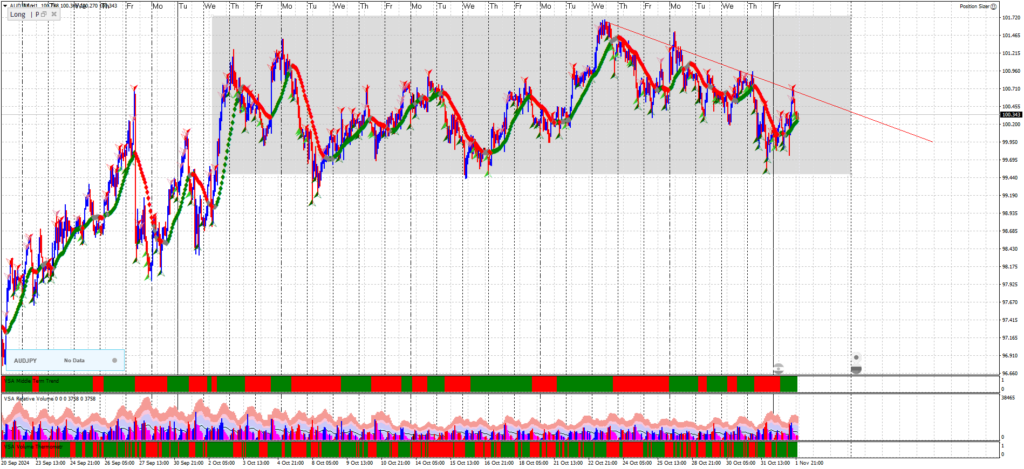
- The H1 chart for AUD/JPY aligns with the broader H4 range, confirming oscillation between 99.500 and 100.600.
- This timeframe shows finer details within the H4 structure, with smaller swings around support and resistance, suggesting re-accumulation within the larger range.
Wyckoff Events
- Support Tests: Multiple tests of the support level near 99.500 suggest buyer interest. Secondary tests after a spring event could indicate a good buying opportunity.
- Resistance Tests and Potential Upthrusts: The resistance level near 100.600 has held multiple times on this timeframe, with minor upthrust-like moves failing to sustain momentum above this level.
- Accumulation Characteristics: The rejections near the lower boundary with high volume spikes show potential accumulation as sellers fail to push lower.
Volume Analysis
- Volume at Key Levels: Volume increases around 99.500 indicating strong buyer interest, aligning with the re-accumulation hypothesis. Conversely, the volume is lower near resistance, indicating sellers still control this level.
- Breakout Volume: If the price attempts to break above 100.600, look for a volume increase to confirm buyer strength. A lack of volume would indicate a potential failure and reinforce the range.
Trading Implications on H1
- Buy near Support (99.500): Look for spring or secondary test events with high-volume around 99.500 for long entries.
- Sell near Resistance (100.600): Consider short entries if an upthrust forms at 100.600, especially with low breakout volume or quick reversal.

AUD/JPY M15 Chart Analysis (Entry Timing)
Trend and Phase Identification
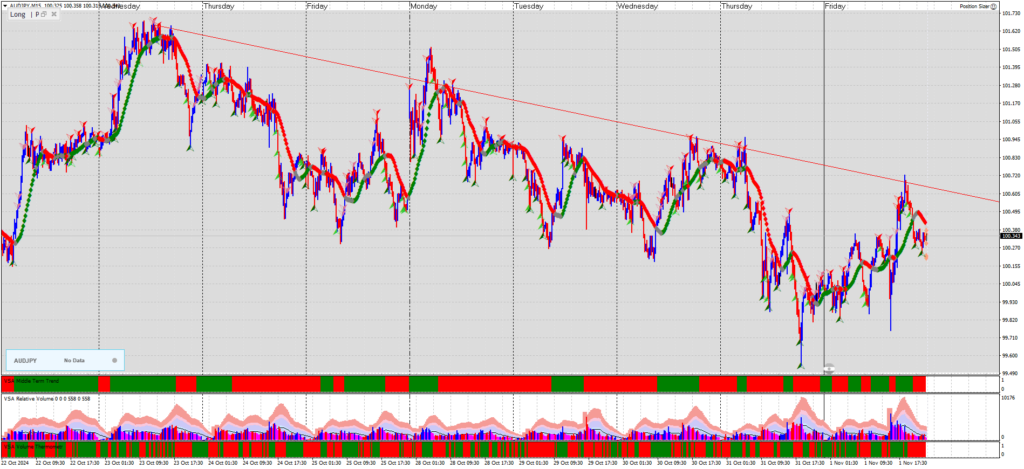
- The M15 chart provides detailed insight into price action around the key H1 and H4 levels (99.500 and 100.600).
- Minor swings and micro pullbacks within the larger range can be identified on this timeframe, helping to time entries around support and resistance.
Wyckoff Events for Entry Timing
- Springs at Support (99.500):
- Look for springs or minor breakdowns below 99.500 that quickly recover with volume. This is a strong sign of buyer presence and would align well with the H1 and H4 support levels.
- Secondary tests following springs could offer an entry confirmation for long positions.
- Upthrusts at Resistance (100.600):
- Near 100.600, upthrust patterns (small breakouts above resistance that fail quickly) with low volume can signal shorting opportunities if the price does not sustain above this level.
- Volume spikes at these levels with reversal patterns would confirm the resistance zone and the likelihood of a retracement back within the range.
Volume Analysis
- Volume Confirmation at Key Levels:
- Volume spikes on springs near 99.500 support indicate buyer absorption, making these areas attractive for buying.
- Conversely, low volume on attempts to break above 100.600 suggests a lack of strength in buying, confirming the resistance zone.
Entry and Exit Strategy Based on M15 Analysis
- Entry near Support (99.500):
- Look for spring and secondary test patterns with volume support at 99.500 to confirm a long entry. Set stops just below these spring patterns to manage risk.
- Breakout or Rejection at Resistance (100.600):
- Wait for a confirmed breakout above 100.600 with high volume for a potential continuation, or look for an upthrust pattern to enter a short if volume decreases at resistance.

Summary
The AUD/JPY analysis across H4, H1, and M15 charts provides a structured approach for trading within the range:
- Range-Bound Trading: 99.500 to 100.600, with buy opportunities near support and sell opportunities near resistance.
- Volume as Key Confirmation: Rising volume on pullbacks near 99.500 supports accumulation, while low volume near 100.600 suggests weak breakout attempts.
- Breakout Potential: A sustained breakout above 100.600 with volume would confirm a shift, potentially initiating a new trend phase.
This analysis across multiple timeframes gives a comprehensive view, aligning entries and exits with Wyckoff principles and confirming with volume at key levels. Let me know if you need further details on any part of this analysis!
