AUD/USD H4 Chart Analysis (Primary Trend)
Trend and Phase Identification
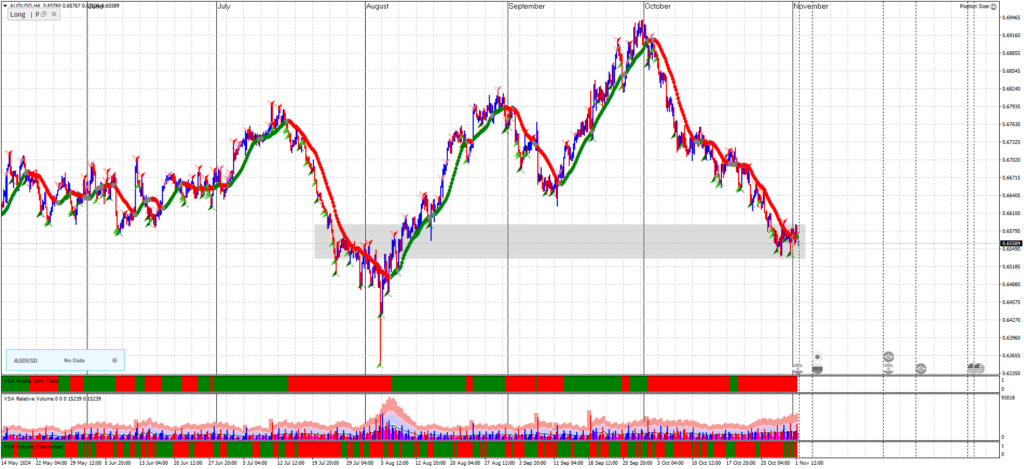
- The H4 chart for AUD/USD shows a clear downtrend that has been ongoing since early October. This downtrend is indicative of a markdown phase in Wyckoff terms, suggesting that sellers are in control.
- There is no significant evidence of accumulation or re-accumulation yet, as price continues to form lower highs and lower lows.
Wyckoff Events
- Signs of Weakness: The sustained lower lows and lower highs in the price action indicate a strong markdown phase, with sellers dominating. This suggests that rallies might be seen as short-selling opportunities until a more definitive phase change occurs.
- Potential Preliminary Support: Around the most recent lows (near 0.6550), we might observe preliminary support, but the downtrend does not show signs of accumulation or strong buyer interest at this level.
Volume Analysis
- Volume on Declines: There are volume spikes on downward movements, which typically suggest strong selling interest. This supports the idea of continued markdown and resistance to bullish attempts.
- Volume on Rallies: Volume tends to diminish on rallies, indicating weak buying interest and supporting the downtrend. This confirms that sellers remain dominant.
Trading Implications on H4
- Shorting Rallies: Look for shorting opportunities on rallies or minor retracements, as the primary trend on this timeframe remains bearish.
- Potential Buy Signals: Only consider long entries if we observe a spring-like event (a temporary breach of support followed by a quick recovery) accompanied by strong volume, which might indicate the start of an accumulation phase.

AUD/USD H1 Chart Analysis (Mid-Level Trend Analysis)
Trend and Phase Identification
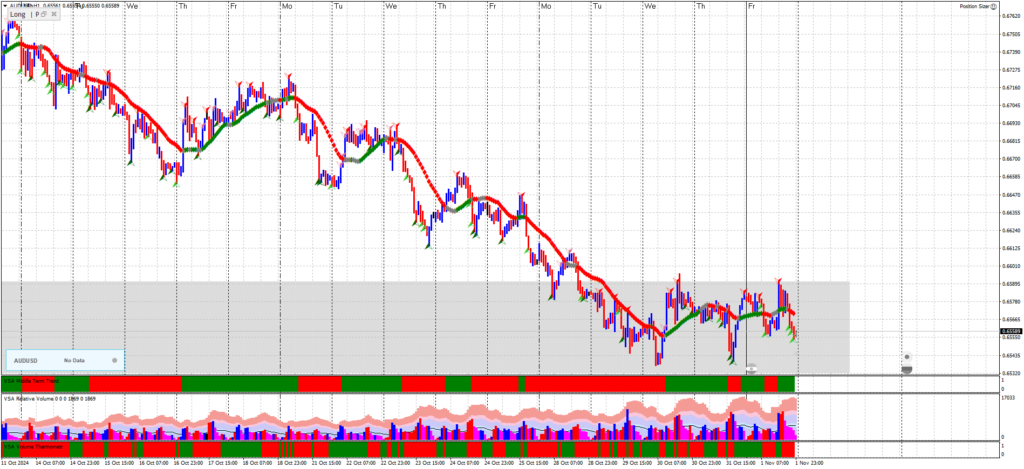
- The H1 chart also confirms the overall downtrend, with price making consistent lower highs and lows. This timeframe aligns with the H4 markdown phase, showing shorter-term rallies that fail to gain momentum.
- The price remains under selling pressure, and there is no visible sign of re-accumulation or significant buyer interest.
Wyckoff Events
- Secondary Tests of Resistance: The rallies on the H1 chart tend to test resistance but lack follow-through, which often results in another leg down. These secondary tests can be used as entry points for short positions if they align with resistance levels and show rejection.
- Absence of Accumulation Signs: So far, there is no evidence of a spring or preliminary support that would suggest accumulation. The price action continues to favor short positions.
Volume Analysis
- Volume on Rejections: Volume tends to spike on rejection of resistance levels, reinforcing the bearish bias.
- Weak Buying Volume: Lower volume on upward moves confirms weak buying interest, suggesting that rallies are likely to be short-lived.
Trading Implications on H1
- Shorting Near Resistance: Focus on shorting opportunities near resistance levels. Look for signs of rejection with high volume on rallies for high-probability entries.
- Caution on Longs: Avoid long positions unless there is a clear change in structure, such as a spring event or volume-based support around a key level.

AUD/USD M15 Chart Analysis (Entry Timing)
Trend and Phase Identification
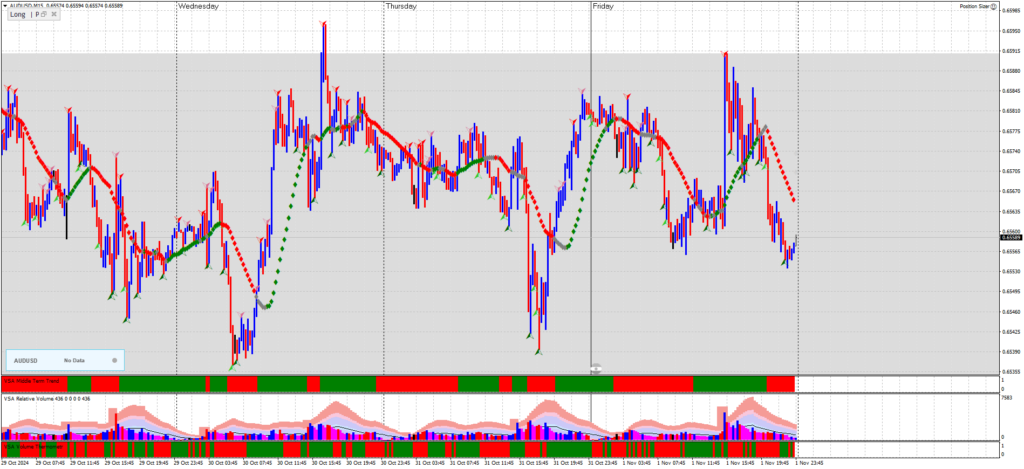
- The M15 chart provides a granular view of the downtrend within the H1 and H4 markdown phases. It shows minor retracements within the broader downtrend, useful for timing entries at resistance levels.
- Price oscillates within smaller swings but remains overall bearish, consistent with the larger timeframes.
Wyckoff Events for Entry Timing
- Upthrusts at Resistance: Watch for minor upthrusts near resistance on this timeframe. These are brief pushes above resistance that quickly fail, often providing excellent shorting opportunities in alignment with the downtrend.
- Volume Confirmation: Look for volume spikes at resistance levels, indicating a potential short entry. Springs are not expected here unless there’s a sign of broader accumulation on higher timeframes.
Volume Analysis
- Volume on Rejections: Volume spikes at resistance confirm seller interest. These volume surges act as indicators for timing short entries.
- Weak Volume on Rallies: Rallies with low volume reinforce the bearish trend, indicating that buyers lack strength, making resistance levels ideal for short entries.
Entry and Exit Strategy Based on M15 Analysis
- Entry at Resistance: Look for upthrust patterns with volume confirmation at resistance to time entries on the short side.
- Stop Placement: Place stops slightly above recent resistance peaks to manage risk in case of a breakout.
- Take Profit: Use lower support zones on M15 or let the trade run in alignment with the H4 trend.

Summary
The AUD/USD analysis across H4, H1, and M15 charts suggests a continuation of the downtrend with shorting opportunities:
- Bearish Bias: The overall trend across all timeframes is bearish, with shorting opportunities on rallies and resistance rejections.
- Volume as Confirmation: Rising volume on downward moves and weak volume on rallies reinforce the markdown phase.
- Timing Short Entries: Use the M15 chart to enter short positions at resistance, with volume spikes confirming resistance rejections.
