USD/JPY H4 Chart Analysis (Primary Trend)
Trend and Phase Identification
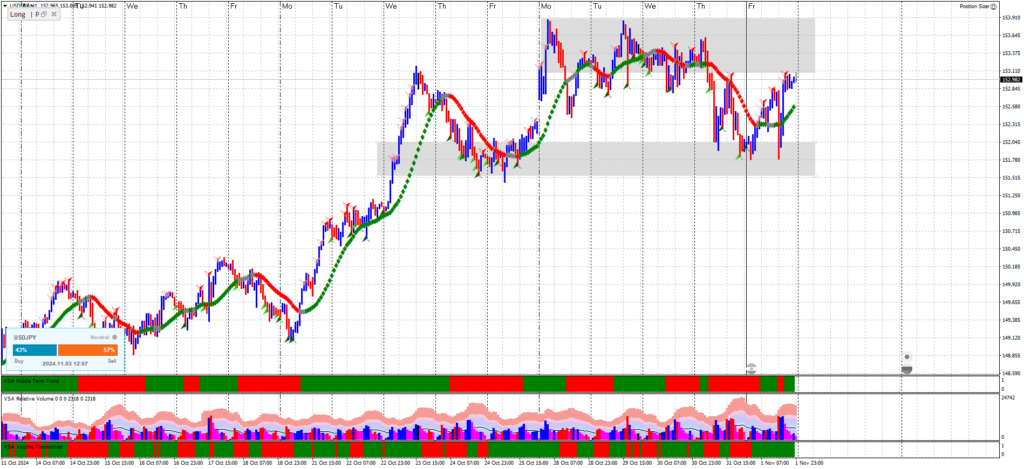
The USD/JPY H4 chart shows a general upward trend, evident from early October. This upward trend could indicate a markup phase in Wyckoff’s terms, where prices are generally rising after what appears to be a prior accumulation phase in late August to early September.
Wyckoff Events
The accumulation zone in August-September shows characteristics like minor consolidation and pullbacks, followed by a breakout in October.
Key signs of strength in early October support a bullish bias, suggesting that the trend could continue upward as long as it maintains key support levels.
Volume Analysis
Notice the volume spikes during pullbacks, indicating potential buyer absorption on dips. If volume increases on further pullbacks, it could signal another re-accumulation phase, strengthening the bullish case.
USD/JPY H1 Chart Analysis (Mid-Level Trend Analysis)
Trend and Phase Identification
The USD/JPY H1 chart reflects an oscillating pattern but aligns within a larger upward trend visible from early October on the H4 timeframe. This could indicate that the H1 chart is in a re-accumulation phase within the broader markup trend seen on H4.
The price appears to be consolidating, moving between key support and resistance levels, which is characteristic of re-accumulation. This phase often serves as a pause within an uptrend, gathering momentum for a potential continuation of the upward movement.
Wyckoff Events
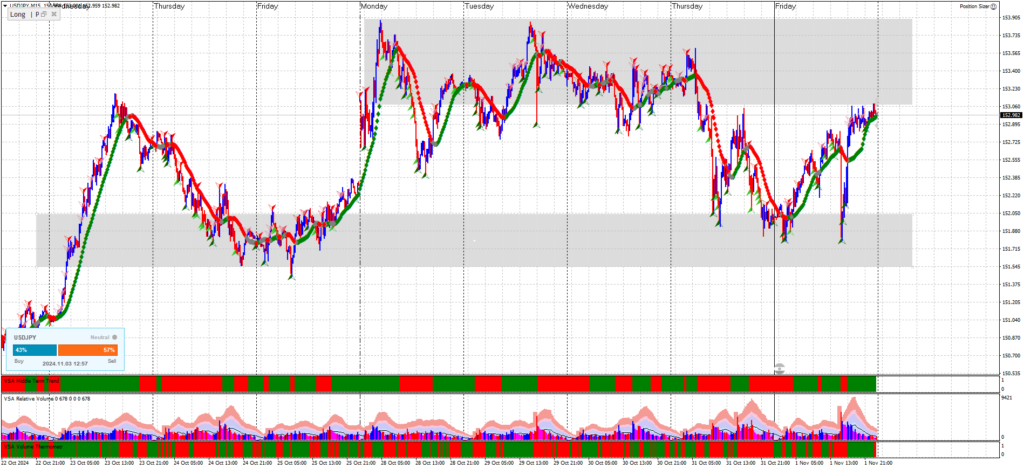
In late October, we observed multiple tests of the support level around 152.000, suggesting that buyers are absorbing selling pressure in this region.
The range between 152.000 and 153.000 may serve as the re-accumulation zone, with possible springs (minor breakdowns followed by reversals) occurring near 152.000, where the price briefly dips below support but quickly recovers.
Key signs of strength are observed as the price rises from support at 152.000 to resistance at 153.000, indicating strong demand at the lower boundary. Each upward movement within this range suggests that buyers are in control, especially if supported by rising volume.
Early November attempts to break resistance at 153.000 could signal an imminent breakout. If successful, this would be a sign of strength in line with the broader H4 uptrend, confirming the re-accumulation phase.
Volume Analysis
There are volume spikes during pullbacks towards 152.000, indicating buyer interest as sellers fail to push the price significantly lower. This absorption of selling pressure suggests re-accumulation within the range.
Volume spikes on upward moves toward 153.000 indicate strong buying pressure, potentially leading to a breakout if sustained.
If we see increasing volume on further pullbacks towards the lower boundary (around 152.000), it could indicate strong buyer interest, reinforcing the re-accumulation phase. Conversely, increasing volume on a breakout above 153.000 would signal the continuation of the markup phase.

Entry Strategy:
Look for buy opportunities near the 152.000 support level if the price shows spring-like behaviour (a dip below support with quick recovery) accompanied by volume spikes. This would indicate that buyers are absorbing any selling pressure, supporting the re-accumulation phase.
Alternatively, wait for a breakout above 153.000 with strong volume as confirmation to enter a long position in line with the broader H4 trend.
Stop Loss and Target:
For entries near 152.000, a stop-loss slightly below this support level would manage risk in case of a deeper pullback.
For a breakout entry above 153.000, consider a stop-loss just below the breakout level after confirmation.
Take profit at resistance levels or trail your stop to capture the broader uptrend continuation as long as the price remains above key support levels.
USD/JPY M15 Chart Analysis (Timing Entry)
Trend and Phase Identification
The M15 chart shows minor fluctuations within the broader H1 re-accumulation range (152.000 to 153.000). These fluctuations provide opportunities to spot high-probability entries near support and resistance.
Given the uptrend in the H4 chart and re-accumulation phase on the H1, the M15 chart should be used to identify micro-patterns that align with potential buy entries around support and breakout entries near resistance.
Wyckoff Events for Entry Timing
Around Support (152.000):
Springs: Look for spring patterns around the 152.000 level, where the price briefly dips below support and quickly rebounds with a strong bullish candle. These springs should ideally be accompanied by volume spikes, indicating buyer interest and absorption of selling pressure.
Secondary Tests: Once a spring occurs, a secondary test of the 152.000 level may follow, forming a higher low. This higher low can serve as a confirmation entry signal for a long position, especially if volume remains elevated, showing continued buyer interest.
Around Resistance (153.000):
Upthrusts: If the price approaches 153.000 and shows signs of an upthrust (a brief break above resistance that quickly reverses), this may indicate short-term selling pressure. However, if the upthrust fails and the price reclaims 153.000 with strong volume, it may signal a breakout opportunity.
Breakout Confirmation: Wait for a confirmed breakout above 153.000 with sustained volume. A breakout retest pattern (where the price breaks out, pulls back to test 153.000 as support, and then rebounds) is an ideal entry confirmation for continuation in line with the H4 uptrend.
Volume Analysis
Volume Spikes at Key Levels:
At 152.000: Monitor for volume spikes on downward moves to 152.000. High volume with limited downward movement indicates that buyers are absorbing the selling pressure, a signal that strengthens the support level as a buy entry.
At 153.000: Increasing volume as the price approaches 153.000 may signal the potential for a breakout. Watch for volume surges after the breakout above 153.000 as confirmation, especially if accompanied by a bullish candle closing above this level.
Diminishing Volume on Pullbacks: During pullbacks from 153.000 after an initial breakout, a decrease in volume indicates that sellers are not strongly defending resistance, suggesting that a retest of 153.000 could hold as new support.

Entry and Exit Strategy Based on M15 Analysis
Entry Near Support (152.000):
Look for spring and secondary test patterns with volume support near 152.000 to confirm buyer absorption. Enter on bullish confirmation after a spring or a secondary test.
Breakout Entry Near Resistance (153.000):
For a breakout entry, wait for a solid close above 153.000 with strong volume. Ideally, a retest of 153.000 with diminishing volume, followed by a bullish reversal, will confirm that resistance has turned into support.
Stop Loss and Target Placement
Entries at 152.000: Place the stop-loss slightly below the spring or secondary test pattern to manage risk on buy entries near support.
Breakout Entries at 153.000: Use a stop-loss slightly below 153.000 after a confirmed breakout to protect against potential false breakouts.
Profit-Taking: Scale out of the position or trail the stop as the price moves in favour of the trade, following the continuation of the broader H4 trend.
Summary
The M15 chart provides high-probability entry opportunities within the key H1 re-accumulation range:
Buy near 152.000: Look for springs or secondary tests with volume support.
Breakout entry above 153.000: Enter on breakout confirmation with strong volume and a successful retest.
This M15 analysis complements the H1 and H4 structure, allowing for precise entry timing while staying aligned with the broader bullish trend. Let me know if you’d like further details on specific entry techniques!
