Trading forex during high-impact news announcements can be both risky and rewarding. In this blog, I’ll share how I used Wyckoff Volume Spread Analysis (VSA) to trade EUR/USD following a worse-than-expected Flash PMI announcement. This trade was a great example of how VSA principles can help identify opportunities when the market is volatile and fast-moving.
The Setup: Weekly Chart and Key Support Level
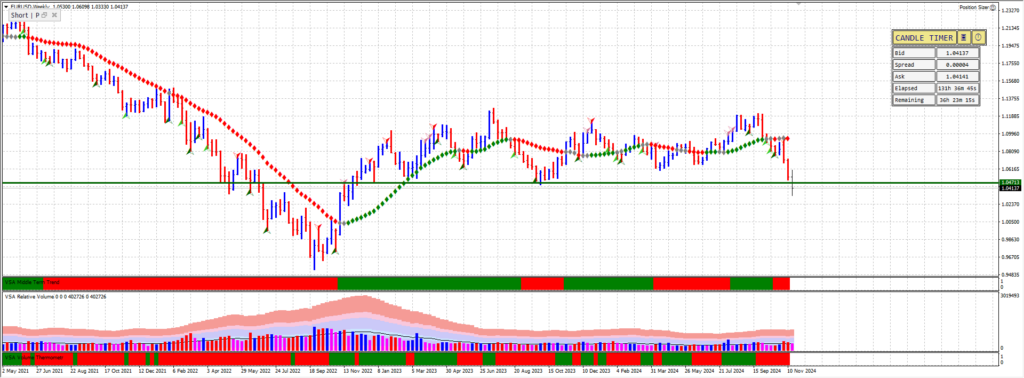
Before the news announcement, I had already analyzed the EUR/USD weekly chart. One critical level stood out: a well-defined support level that had previously held price action multiple times. This support level was my focus because significant news events often cause prices to test or break such levels.
When the Flash PMI data was released, showing a weaker-than-expected result, EUR/USD began to drop sharply. This aligned perfectly with the bearish sentiment caused by the disappointing economic data. My plan was to trade a potential break of support, using VSA to confirm the market’s behaviour.

The VSA Signal: Ultra-High Volume Widespread Bar
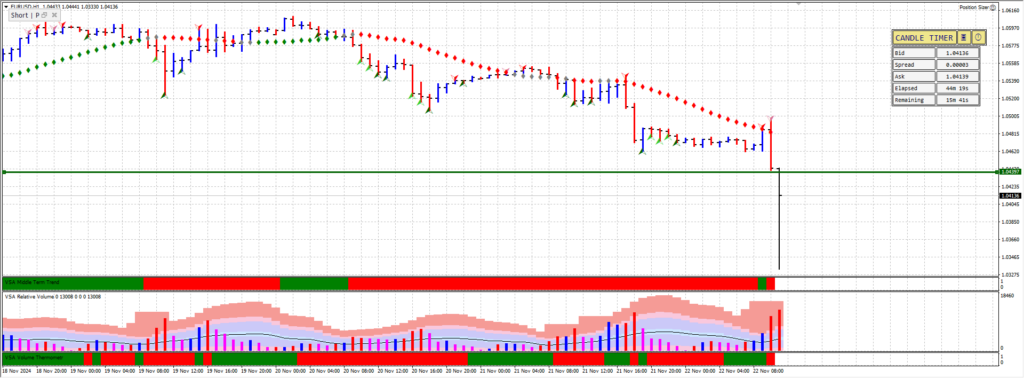
As the price approached the key support level, a widespread bar formed with ultra-high volume. In Wyckoff VSA, this type of bar is a critical signal that professional money (institutional traders) is active in the market. Here’s why this bar stood out:
This is a key characteristic of supply overwhelming demand, a hallmark of bearish momentum.
Ultra-High Volume:
Indicates significant activity in the market, typically driven by large players. Following the negative news, this volume spike suggested aggressive selling, likely from institutions unloading positions.
Widespread Bar:
The bar covered a large range from high to low, showing that sellers were in control throughout the session. It’s a visual representation of urgency in the market, often seen when news catalyzes price action.
Closing Near the Low:
The bar closed near its low, confirming that there was little buying interest to counter the selling pressure.

The Entry: Break of Support
Once the price broke the support level, I entered the trade. VSA principles suggest that a break of support following an ultra-high volume bar is a strong sign that the bearish move has momentum. Here’s why this entry made sense:
- Confirmation of Supply: The widespread bar was a clear indication that professional sellers were active. A break of support validated this bearish sentiment.
- Reduced Risk of Reversal: The ultra-high volume suggested that any buying at the support level was being absorbed by stronger selling pressure, reducing the likelihood of a bounce.
- Momentum from News: Negative news often accelerates existing trends or triggers new moves, making this a high-probability trade.
Managing the Trade: A Quick Profit Strategy
My plan was to make a quick profit, given that the support level had been significant on the weekly chart. While there was potential for a larger move, I was cautious because:
- Support Levels Often Trigger Counter-Moves: Even after a break, the price can retest the level or bounce back if demand resurfaces.
- High Volatility: News-driven trades can reverse sharply, especially in the forex market.
The first leg was exited after a significant move. The second leg if the trade was exited after I moved the stop loss beyond the break event point. While I didn’t capture the entire move, I followed my plan, which is always more important than chasing profits.
VSA Analysis: Why This Bar Was “Supply Coming In”
In VSA terminology, the ultra-high volume widespread bar is identified as supply coming into the market. Here’s a deeper breakdown:
- What is Supply?
- Supply represents selling pressure, usually from large market participants like institutions or hedge funds.
- When supply dominates, prices fall because there’s not enough demand to absorb the selling.
- Why Was This Bar Supply?
- The ultra-high volume combined with the widespread and a close near the low indicated that sellers were overwhelming buyers.
- The bar formed just above the key support level, suggesting that professional sellers were pushing the price down, targeting the break of this critical level.
- Market Psychology:
- Retail traders might see high volume at support and assume buying is happening. However, in VSA, this often signals that smart money is unloading positions into retail buying.
Lessons Learned
- Importance of Support and Resistance:
- Identifying key levels in advance helps you anticipate market behaviour during high-impact events.
- In this trade, the support level acted as a magnet for price action and a decision point for market participants.
- Using VSA for Confirmation:
- The ultra-high volume widespread bar was a textbook example of professional selling. Without this signal, I wouldn’t have had the confidence to enter the trade after the break.
- Quick Profit vs. Full Move:
- While I didn’t capture the entire move, my decision to treat this as a quick trade aligned with my plan. Having a clear exit strategy is critical, especially in volatile markets.
Tips for Traders Using VSA
If you want to incorporate Wyckoff VSA into your trading, here are some tips:
- Look for Volume Spikes: High volume often signals professional activity, whether it’s buying or selling.
- Understand the Spread: The range of the bar provides context for the volume. Wide spreads on high volume often indicate urgency.
- Pay Attention to Closes: A close near the low suggests bearish momentum, while a close near the high signals strength.
- Combine VSA with Key Levels: Volume analysis is most powerful when combined with strong support and resistance levels.
This trade on EUR/USD highlighted the power of Wyckoff VSA in understanding market behavior during news events. The ultra-high volume widespread bar approaching and breaking support was a clear signal of professional selling. While I exited early for a quick profit, the principles of VSA allowed me to confidently enter the trade at the right time.
If you’re looking to improve your trading, start incorporating VSA into your analysis. Understanding the story behind the candles and the volume can give you an edge in identifying high-probability setups.
Have you used VSA in your trading? Share your thoughts or experiences in the comments below!
The End Result
| Trade 1 | Trade 2 |
|---|---|
| Trade Entry Date / Time: 22/11/2024 11:09:36 UTC | Trade Entry Date / Time: 22/11/2024 11:09:36 UTC |
| Symbol: EUR/USD | Symbol: EUR/USD |
| Type: Sell | Type: Sell |
| Entry Price: 1.04178 | Entry Price: 1.04179 |
| Position Size: 0.60 | Position Size: 0.59 |
| Commission: -3.13 | Commission: -3.07 |
| Trade Exit: 1.03567 | Trade Exit: 1.04035 |
| Trade Pips: 61.1 Pips | Trade Pips: 14.4 |
| Profit: $366.60 | Profit: $84.95 |
| Profit %: 0.36 | Profit %: 0.083 |

Leave a Reply