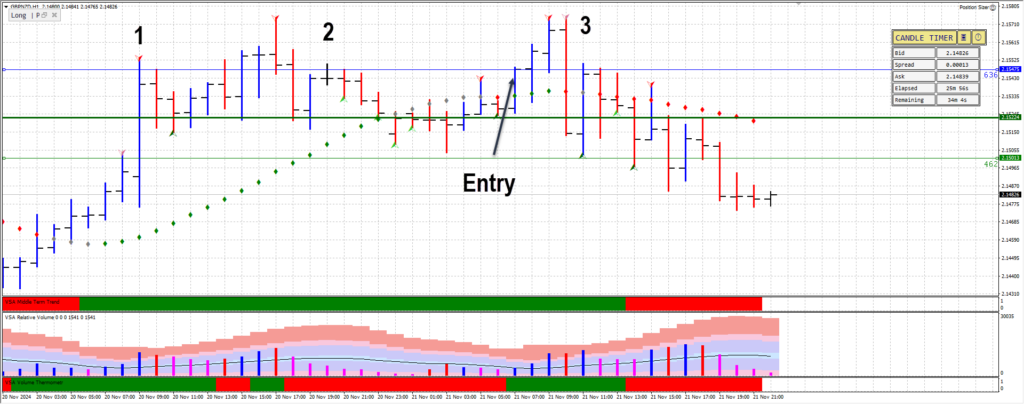
This trade was brief, and I opted to exit early due to clear signs of weakness appearing in the market. Let’s dissect why I made this decision. Initially, all timeframes aligned with an uptrend, suggesting strength in the market. However, on closer analysis of the chart, subtle clues pointed to potential weakness emerging. Despite the prevailing upward trend, I remained cautious, aware that professional money might already be offloading positions.
The reason for entering the trade was based on the Wyckoff test following a period of no demand. After confirming the test, I initiated a long position. Prices rallied to a previous high, but shortly after, a key Volume Spread Analysis (VSA) principle became evident: “Supply Coming In.” This was accompanied by ultra-high volume at the high, a classic indication of professional distribution. Recognizing this, I made the decision to exit the trade promptly. My earlier analysis had underestimated the extent of distribution already underway.
Chart Analysis:
- Point 1: Professional money begins the distribution phase. This is the early stage of their campaign, where they offload holdings while enticing retail traders to buy into the uptrend.
- Point 2: The market makes a retest of the high, forming an upthrust. Note how the bar breaks above the previous high, luring the herd into long positions. This is a textbook example of an upthrust as it fails to follow through, signaling weakness.
- Point 3: I entered the trade after a test of supply. However, the supply bar that followed made it evident that the distribution was continuing, marking my mistake in initiating the trade during this phase.
The Next Steps:
Now, my focus shifts to the trigger point, which lies at the low of the supply bar. If the price breaks below this level, it will confirm a change in behaviour, signalling the transition from distribution to markdown. I will look for short opportunities below this trigger point, aligning with the path of least resistance.

The End Result
| Trade 1 | Trade 2 |
|---|---|
| Trade Entry Date / Time: 21/11/2024 08:00:33 UTC | Trade Entry Date / Time: 21/11/2024 08:00:33 UTC |
| Symbol: GBP/NZD | Symbol: GBP/NZD |
| Type: Buy | Type: Buy |
| Entry Price: 215.475 | Entry Price: 215.475 |
| Position Size: 1.86 | Position Size: 1.85 |
| Commission: -11.76 | Commission: -11.70 |
| Trade Exit: 215.562 | Trade Exit: 215.564 |
| Trade Pips: 8.7 Pips | Trade Pips: 8.9 |
| Profit: $94.91 | Profit: $96.57 |
| Profit %: 0.083 | Profit %: 0.085 |

Leave a Reply