Which Currencies In Trend Alignment
The following currencies are in trend alignment based on four timeframes; 4-hour, daily, weekly and monthly:
- AUDUSD
- NZDUSD
- AUDCHF
- USDCAD
Australian Dollar / US Dollar
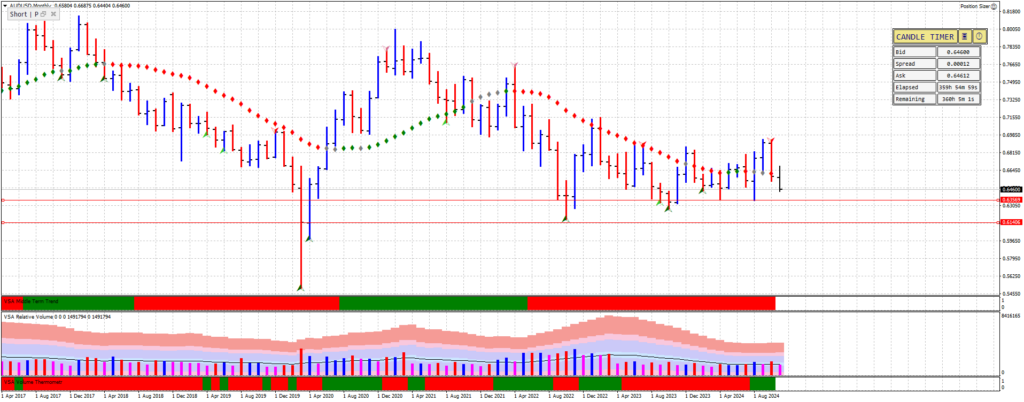
The AUDUSD is in a downtrend on three of the four timeframes: 4-hour, daily and weekly. The monthly chart is starting to turn, but based on the monthly chart this currency pair does look weak. In October, we saw a VSA principle two-bar reversal after an attempt to rally. So far in November we see the currency down. I am mindful of the strength in the background which occurred in March & April 2020.
The key levels to look out for are 0.63569 and 0.61406.
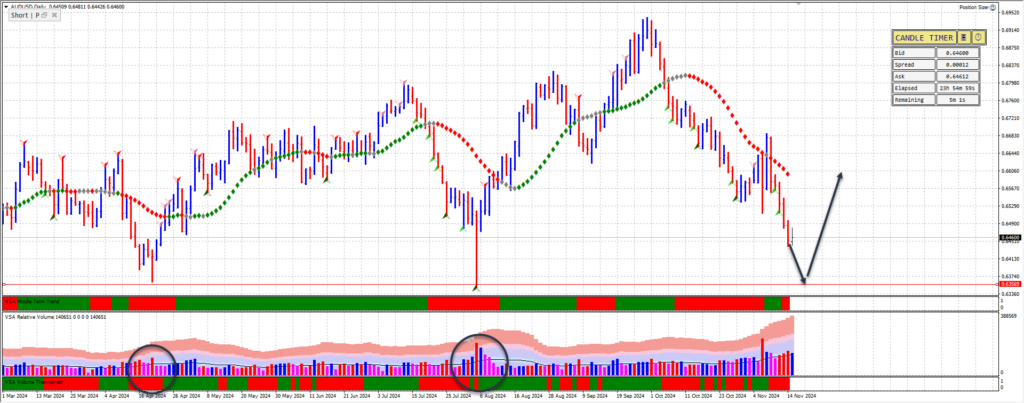
The daily chart shows we are entering a significant area as this current level is where ultra-high volume has appeared and we have seen the currency rally from this point on. As identified on the monthly chart the nearing support level is 0.63569 so this level is key. So a possible trade scenario is for the currency to test our support and bounce off this key level. If we do break beneath 0.63569 then we’ll look at further signs of weakness below this level.
Australian Dollar / Swiss Franc
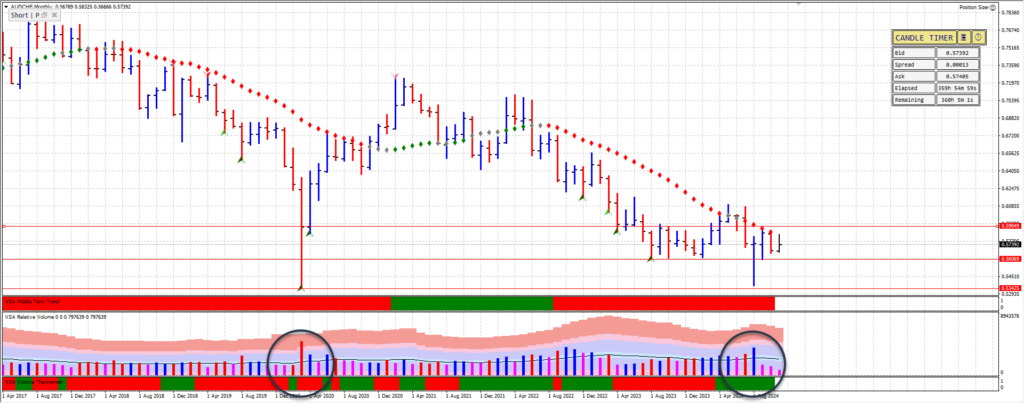
The Australian Dollar / Swiss Franc is also in a downtrend on the 4-hour, weekly and monthly timeframes. On the monthly chart, we have already seen the currency fall into the ultra-high volume area but the attempt to rally has been meagre. The high volume that we see on Aug 24, the next up bar was on below-average volume. It rallied towards the trigger point but has since come off. The current immediate support is at 0.56069 and after this level is 0.53425. The area of resistance is 0.59049.
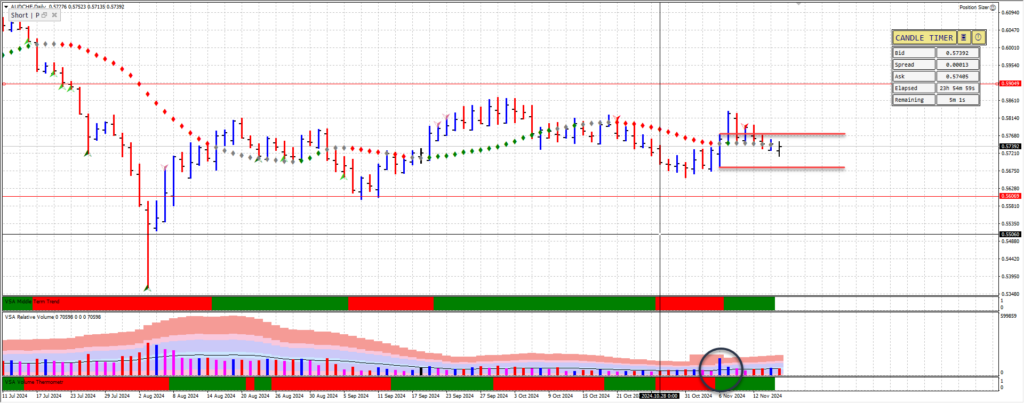
The daily chart shows we are in a significant area, an area of ultra-high volume. So the immediate support and resistance levels are 0.58323 and 0.56840.
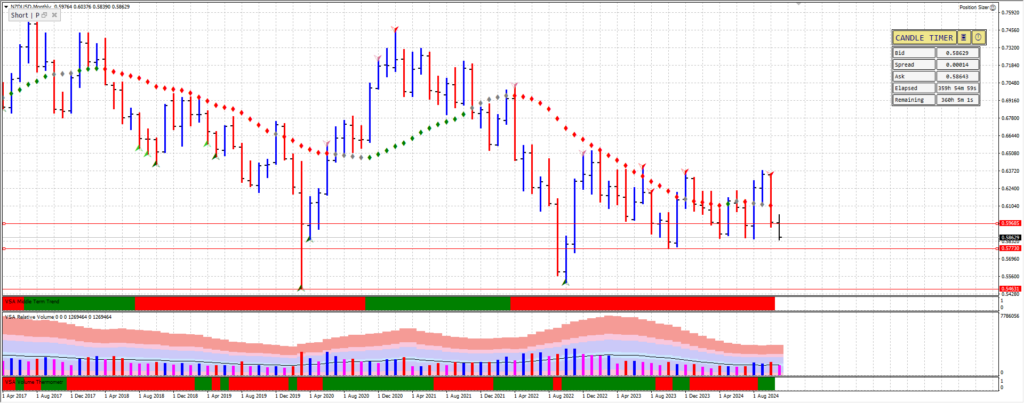
New Zealand Dollar / US Dollar
Similar to the Australian Dollar there is a Two-bar reversal in October and the price is coming up to the area of ultra-high volume. There is immediate support at 0.57730 and if this level is broken then the range of 0.5560 and 0.54631 will be the next key level.
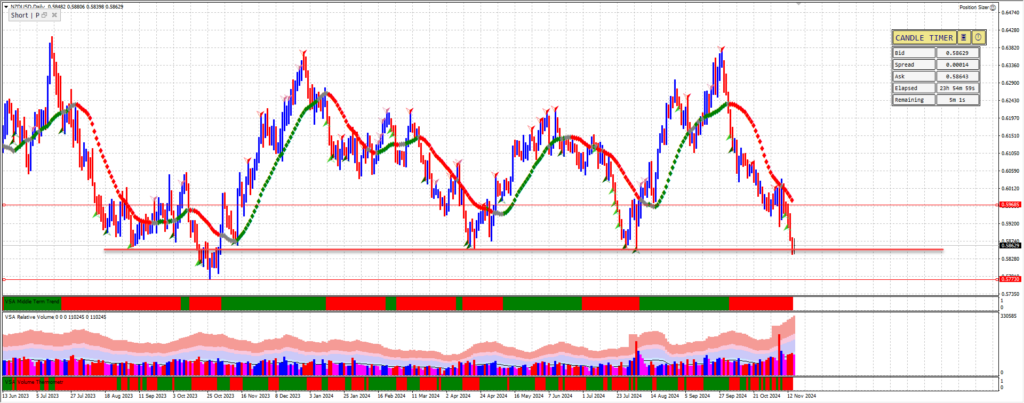
On the daily chart, the current price level is key. We are trading in an area of support and a rebound off this area we are likely to retest 0.59685.
US Dollar / Canadian Dollar
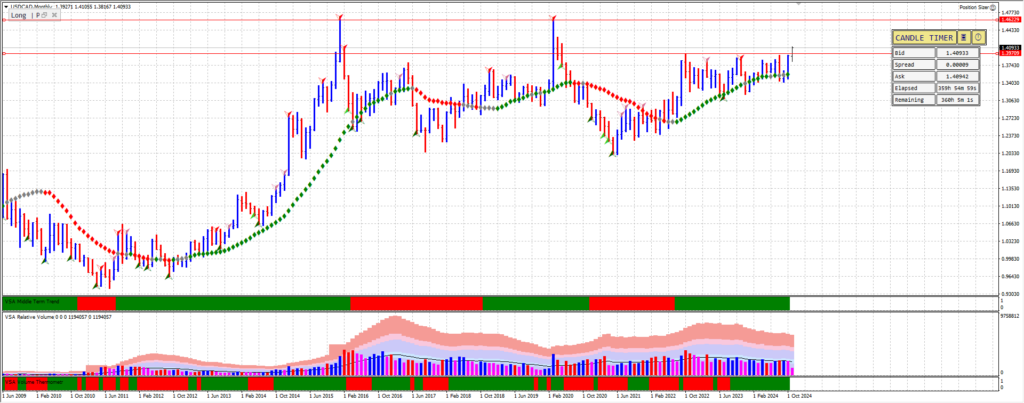
This currency pair on the monthly chart shows that we are likely to rally back towards the resistance at 1.46229. It has a current resistance of 1.39709 so I am looking for it to rally further.
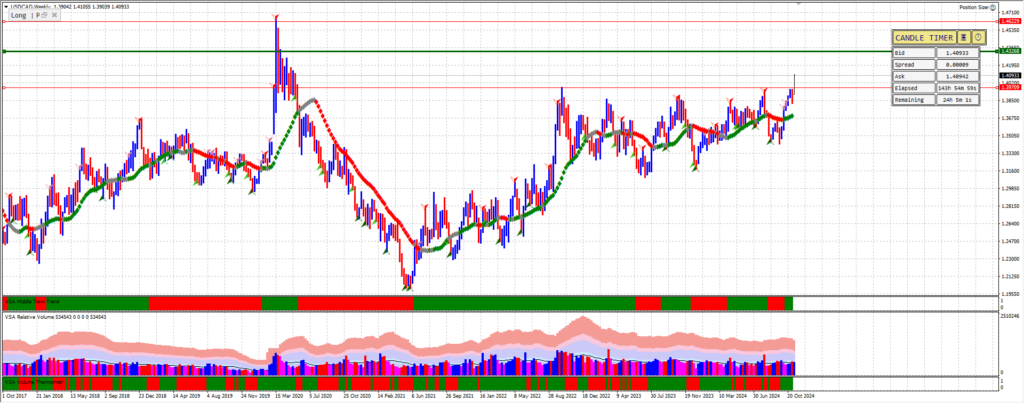
The weekly chart shows we are rallying towards our trigger point at 1.43268, an area of ultra-high volume.

Leave a Reply